Engineering case study · IoT · Full-stack development
Atmos: Building a Home Climate Monitor from Sensor to Screen
Self-assembled ESP32-C3 + SHT31 nodes · Secure ingestion · Private dashboard
In this case study
A personal IoT project connecting hand-assembled sensor nodes, secure data ingestion, and a weather-aware dashboard.
A clearer picture of home
Atmos started with a practical question: what is actually happening with the temperature and humidity in each room of my home?
A single reading can tell you how a room feels at one moment. Keeping those readings over time makes it possible to see changes, compare rooms, and put current conditions into context. I wanted that information to be easy to access from my phone and clear enough to understand at a glance.
That idea became Atmos: a personal home climate monitoring system that connects physical sensors to a private web dashboard.
Building the sensor nodes myself
The physical side of this project was hands-on. I assembled the sensor nodes myself using ESP32-C3 Super Mini boards and SHT31 temperature and humidity sensors.
The ESP32-C3 handles Wi-Fi connectivity and uploads, while the SHT31 measures the conditions in the room. Each sensor connects over I²C, with SDA on GPIO 8, SCL on GPIO 9, and power supplied at 3.3 V.
The firmware uses Arduino C++ and PlatformIO, together with the Adafruit SHT31 library. In testing mode, a node reads its sensor and sends a measurement every 60 seconds. Each node has its own device identity, allowing Atmos to associate incoming measurements with the correct room.
A second firmware mode prepares the system for lower-power operation. The ESP32 wakes, takes a reading, connects to Wi-Fi, uploads the result, and returns to deep sleep for five minutes. That sleep cycle is implemented; actual battery life still depends on the board and power setup and needs to be measured on the hardware.
Connecting hardware to a secure backend
Once the sensor could produce a reading, the next part was getting that reading into the dashboard reliably.
The data flow is straightforward:
SHT31 → ESP32-C3 → HTTPS endpoint → Supabase database → Atmos dashboard
Each device sends its UUID, temperature, and humidity to a Supabase Edge Function. The endpoint authenticates the device, checks that it is active, validates the measurements, and stores the reading with a server-generated timestamp.
Every sensor has its own API key. Only a secure hash of that key is stored on the backend, and individual keys can be rotated or revoked. The ESP32 never receives the Supabase service-role key. Household access is handled separately through Supabase Auth and Row Level Security, with dashboard viewers given read-only access to the data.
Reliability also matters when Wi-Fi is inconsistent. The firmware attaches a unique identifier to each upload so a retry can be recognized without creating a duplicate reading. The dashboard refreshes every minute and reloads data when the connection returns or the app becomes active again.
Making the dashboard useful at a glance
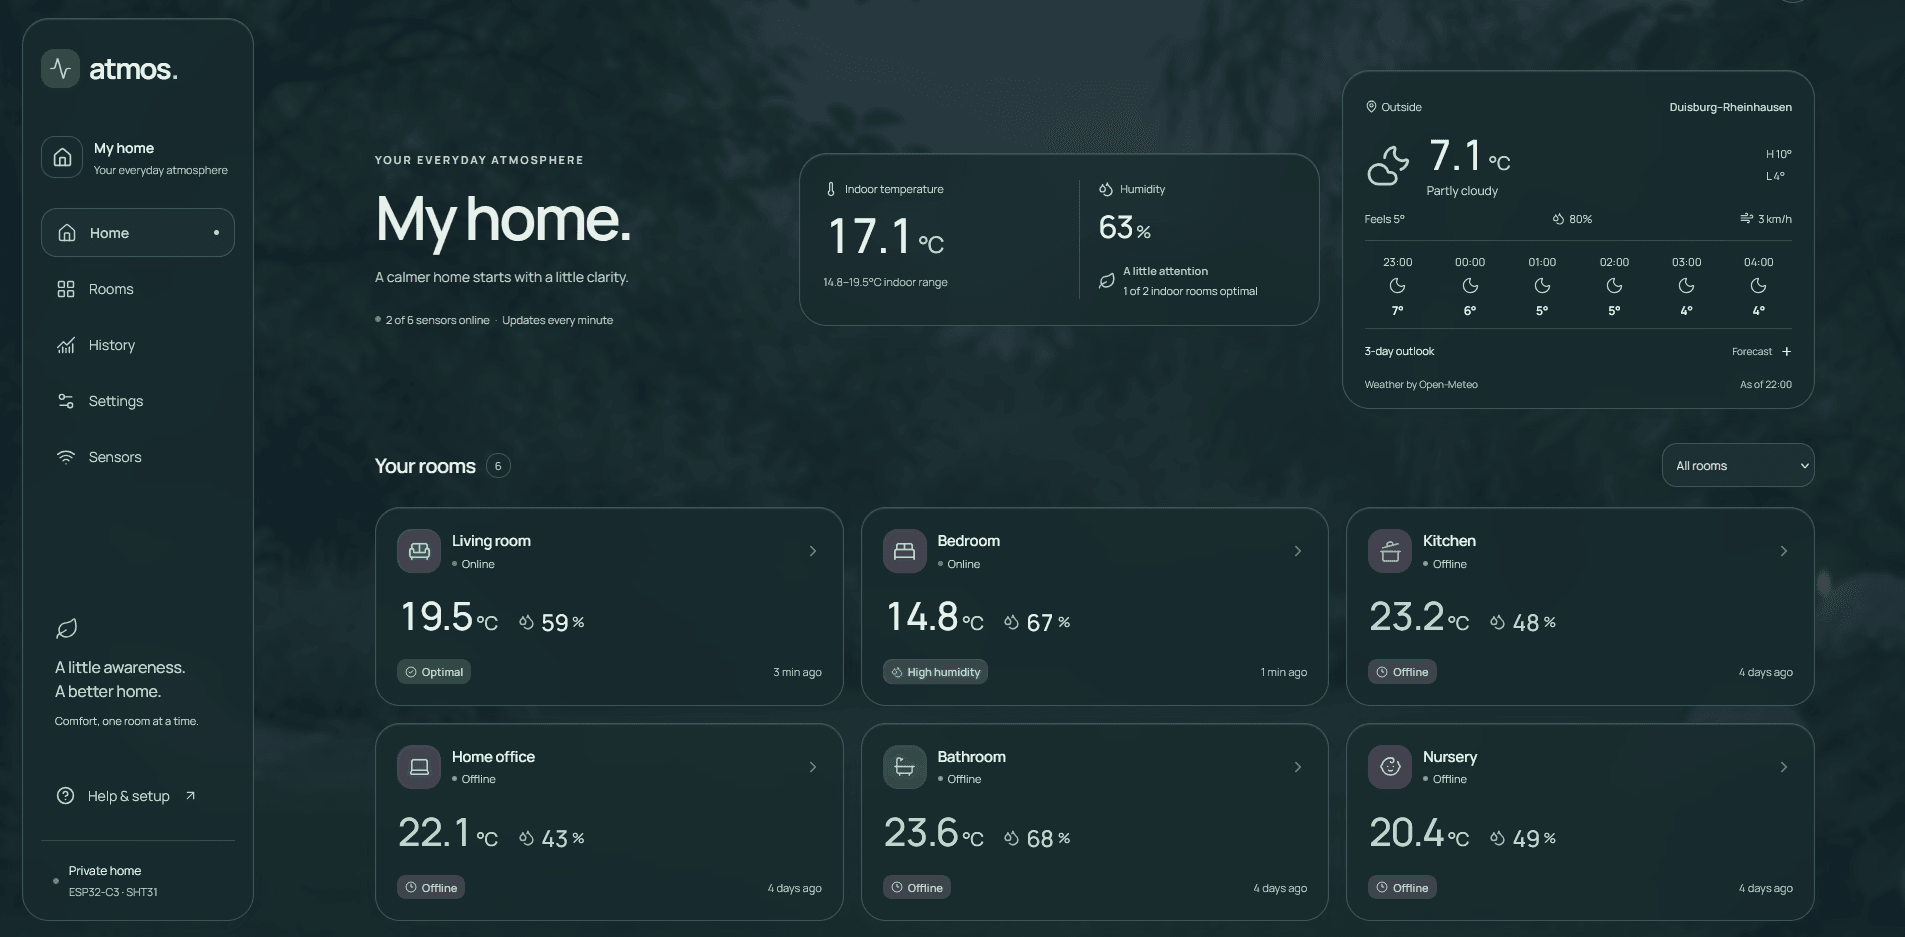
Atmos is built with Next.js, React, TypeScript, and Tailwind CSS. The home screen brings together an indoor overview, outdoor weather, and cards for individual rooms.
Each room card shows the current temperature, relative humidity, the age of the last reading, and the sensor's status. Opening a room reveals temperature and humidity charts for the last 24 hours, seven days, or 30 days. Longer histories are aggregated in PostgreSQL to keep the amount of chart data manageable.
One important detail is how the interface handles readings that are no longer current. A sensor becomes offline after ten minutes without a new measurement. Its last-known values remain visible, but they are clearly marked and excluded from current indoor averages. That helps distinguish what the system knows now from what it last observed.
The layout adapts to mobile and desktop screens, with light, dark, and system themes. PWA support also allows Atmos to be installed on Android when supported by the browser.
Giving the interface a sense of place
The visual direction combines glass surfaces, generous spacing, and a garden background that responds to outdoor conditions and the time of day. The aim is to make checking the home feel calm while keeping measurements easy to read.
Outdoor weather comes from Open-Meteo and remains separate from the physical indoor sensors. It adds context through current conditions and forecasts, while the room measurements continue to come from the hardware I assembled.
Appearance controls let the user choose a garden or minimal background, adjust animation intensity, and change the weather location. Motion also respects reduced-motion preferences. The atmosphere supports the information on the screen; the readings remain the focus.
From individual parts to a working system
Atmos brings together embedded hardware, firmware, API design, database access, and frontend development in one working project. The frontend is deployed on Vercel, with Supabase handling authentication, data storage, and sensor ingestion. Incoming readings appear without rebuilding the application.
The central challenge is keeping those parts consistent. A measurement needs to belong to the right device, survive a network retry, remain private, and appear with enough context for someone to judge whether it is still current. The same care applies when a sensor stops reporting or the dashboard loses its connection.
For me, the defining part of Atmos is that the project starts with hardware I assembled and ends with a dashboard connected to my own home. It turns small, repeated measurements into something practical: a clearer view of the spaces I use every day.
I assembled the physical sensor nodes myself. The software and documentation were developed with Codex assistance.
Hardware: ESP32-C3 Super Mini · SHT31 · I²C
Firmware: Arduino C++ · PlatformIO · Adafruit SHT31
Web: Next.js · React · TypeScript · Tailwind CSS · Recharts
Services: Supabase · Open-Meteo · Vercel
The deployed dashboard requires an authorized household account.